
“Add question” interface for 1KA (Master thesis)
What is it?
The title of my master thesis was “Redesigning the user interface for adding questions in the 1KA survey tool”, where I tackled the problem of the UI window that users interact with when adding questions into their questionnaire using the 1KA survey builder.
Abstract
Introduction
The interface for adding questions is an extremely important functionality in online survey tools, as it is used many times by users during the survey creation process. It is an interface that contains or leads to a set of all the question types that a particular tool allows. The question types can be grouped or provided in a non-grouped list. In the case of a large number of questions types, the problem arises of presenting the whole set of questions in an intuitive and clear way, and in the case of too many groups, the need for too many additional clicks may arise. The aim of the master thesis was to develop a starting point for the redesign of the interface for adding questions in the 1KA tool.
Methods
Two empirical methods were used. First, we systematically reviewed a set of 22 comparable or competing tools. In doing so, we identified 19 characteristics or variables describing the appearance, functionalities and operations of each interface. Next, we conducted a card sorting method, where 37 question types were sorted and renamed by five participants. The aim was to create meaningful groupings that reflect the mental models of the users.
Results
The review of tools highlighted a number of good design choices which we included as elements of the interface redesign proposal, while the card sorting method showed that the current structure of the groups in the 1KA interface does not fully match the mental models of the users.
Discussion
Based on all the results, we have drawn up the elements of a proposal for the redesign of the 1KA interface. The practical proposal contains nine building blocks, 10 thematic groups and 38 question types.
The problem
1KA is an online survey tool. When users build their surveys on the platform, they constantly have to add questions, making this feature arguably the single most used feature on the platform. It is used by every user multiple times per session. This makes any usability issue persistent, even if its impact is small, simply due to the frequency of its occurrence.
The previous interface for adding questions on 1KA was not great. It suffered from many smaller usability issues, making it a prime candidate for the topic of my thesis. The main identified issues were:
The groups of question types are created arbitrarily, without the consultation of users
Question types in the UI don’t include any type of visual representations using iconography, because of which the search time is extended
Rarely used question types are too exposed
Unclear naming of some of the question types, especially for laymen
The inclusion of elements, which aren’t questions, in between the actual questions
Certain important and commonly used question types are hidden under the fold and require scrolling
The UI doesn’t show all question types because of the confusing way they’re structured in the backend
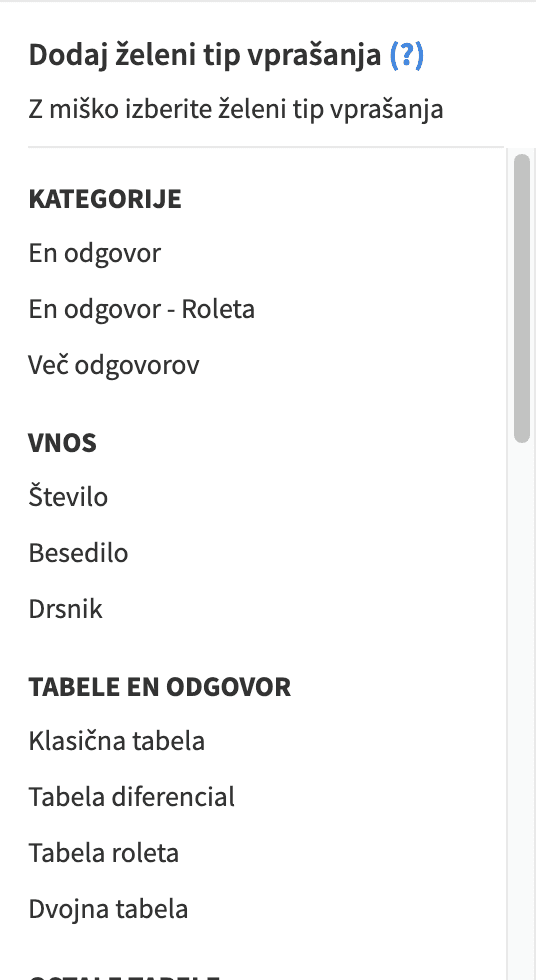
Old 1KA UI for adding questions:
The approach
Method 1: Competitor analysis
I defined points of interest including building blocks, number of clicks required to add a question, number of question types, number of columns, type of interface and many more, then looked at 22 different survey tools to learn about how others are doing things and to gather good ideas for the prototyping stage.
Method 2: Card sorting method
In order to inform how question types should be effectively grouped together, I recruited 5 participants and conducted a card sorting method, where every participant sorted 37 cards, containing different question types, into groups based on their own subjective criteria or feeling. Participants also named the groups they created. Afterwards, I quantitatively and qualitatively analysed the data to come up with a new grouping system for the new UI.
Key findings
Competitor analysis
The user interfaces for adding questions are surprisingly diverse among top tools, which is especially surprising considering how standardised the general flow of creating a survey is. But despite that, the competitor analysis provided useful insights into what’s possible and what our options are. Based on that, we suggested optimal solutions for 1KA for each of the measured variables.
Card sorting
The card sorting method revealed that the mental models of new users does not align with neither 1KA’s current categorisation of questions, nor other tools’ categorisation. We found that users often ignore statistical characteristics of question types (such as number of dimensions or measure scale), which are very important to more experienced users. Instead, new users on things that are more obviously apparent, such as graphical similarity or input type. Most importantly, however, they group items based on perceived practical functions they play in the questionnaire - for example, grouping question types such as GDPR consent, E-signature and CAPTCHA in the same category because they play a similar role of “formalities” in the questionnaire.


